What To Measure – Qualitative And Quantitative Data – How To Make It Work For Your School

Noble and Eaton are an experienced educational consultancy which has helped numerous schools. We work with you to achieve better results, increase staff and student wellbeing and facilitate school sites to become multi-functional, bringing in more external lettings and improving usage for all stakeholders. We do this using our data learned from years of research and experience and we are proud to say that schools we have worked with have added value, higher results and raised achievement in all areas, both inside and outside the classroom.

How Could We Help You?

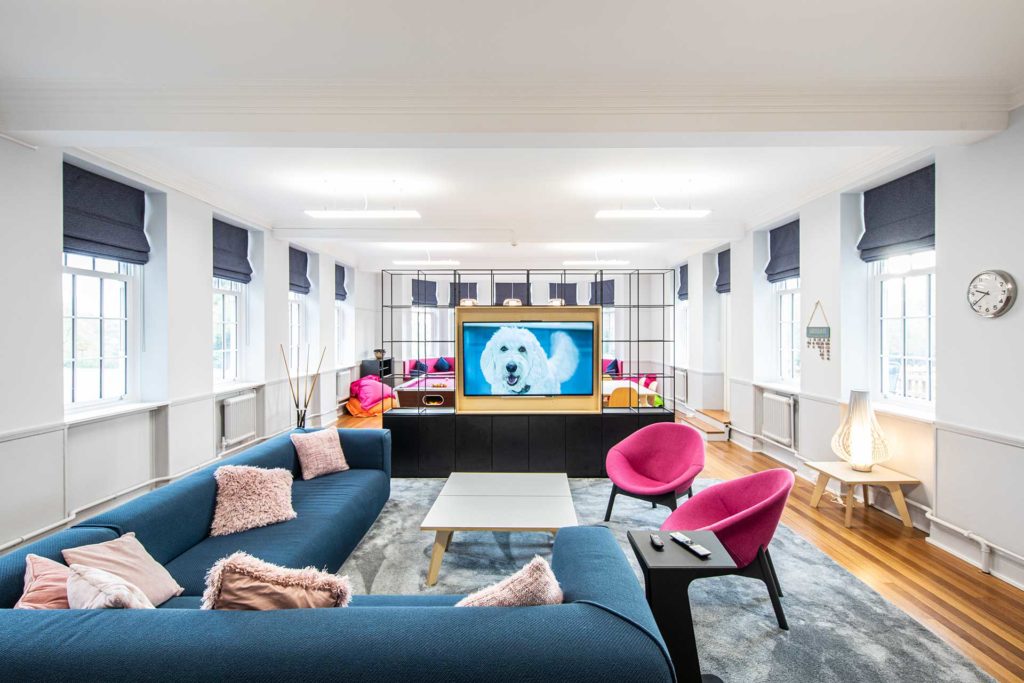
Some school leaders come to us with a very detailed brief. Some just have an idea of what they want to make things better but are not sure how exactly to go about it. Either way, our consultants meet with you, hear your ideas and discuss a range of outcomes. We utilise our tried and tested data to your specific learning environment ensuring all classroom layouts benefit teachers and students, with a focus on health and wellbeing, acoustics, temperature, comfort and the benefits of nature; we firmly believe a happy school is a successful school.

Data – What We Actually Do

Qualitative Data: any text, audio and images from surveys, interviews and our own reading of educational research. We will share these through data visualisation in formats such as word clouds, concept maps, timelines and infographics. They could depict the change to a learning environment has had an impact on standards from a particular school or generic findings across groups of schools as we build up our database of qualitative data. Quantitative Data: any data that we collect which has a quantity, amount or range. This could be physical environmental conditions such as light levels, humidity, acoustics, and temperature, and how they change when the learning environment has been improved. Or baseline attainment and attitude to learning statistics before and after a change to a learning environment. The value added can be expressed in terms of grades or characteristics. These results could be presented as a table, graph or chart.

Which Data Works Best For Me?

Just like your students, senior leaders have different ways they prefer to take in information. Our data styles mean that whether you prefer visual, auditory or kinaesthetic learning we have you covered – visual learners can see on screen how the changes will take place and what your school will look like when completed and at different stages. Auditory learners can discuss their requirements with Noble and Eaton’s experienced consultants who come from educational backgrounds and specialise in exemplary communication. For kinaesthetic learners, we have a range of models, fabrics and coverings. If you are interested in gathering qualitative and quantitative data at your school, please let us know – we’d be glad to assist.